Sustainability Indicators for Chiang Mai
We seek to provide data in the domains of Nature, Economy, Society and Wellbeing. With that data we aspire to create an online and publicly available dashboard to visualise how Chiang Mai performs in the aforementioned dimensions and to identify trends and patterns that may indicate a change of collective behaviour.
Chiang Mai Nayu came into public awareness when we conducted a community consultation with 600 participants in which we explored what Chiang Mai’s residents are most concerned about. From those concerns, the consultation identified potential indicators for monitoring.
The resulting indicators are preliminary and require further refinement for their feasibility – for which we are welcoming technical support.
We are actively looking for individuals, public and private organizations, including municipal offices, to collaborate with us on creating a consolidated public information portal.
The Preliminary Indicators

Nature

Economy

Society

Wellbeing
- Air Quality and Pollution:
- Air Quality Index (AQI) measured between Oct and May (high season)
- Particulate Matter (PM2.5, PM10)

- Natural Resources Conservation:
- Forest Fire Hotspots within Chiang Mai Province by year and months per year
- Percentage of Tree Cover within Chiang Mai city
- Percentage/amount of undeveloped Riverbank within Chiang Mai Valley

- Agriculture and Food Production:
- Annual production in kilos and baht of organic produce
- Number of organic farms vs chemical farms and tons of produce produced
- Amount of Rai/land used to grow industrial corn vs organic produce

- Waste Management and Recycling:
- The amount of CO2 and other toxic gases emitted from the landfill annually
- The number of tons of unsorted solid waste going to landfill
- The amount diverted for recycling and composting
- Diversion of hazardous waste, batteries, etc. to proper municipality dept.
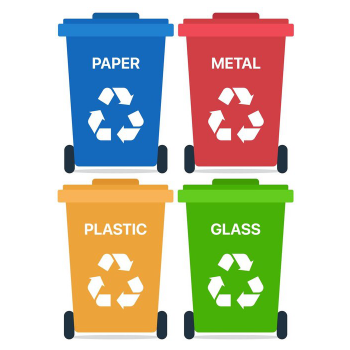
- Waste Management and Recycling:
- The amount of Government budget assigned to sustainable waste management recycling technology and public education
- The percentage households and businesses sorting their waste correctly

- Transportation and Mobility:
- Traffic congestion and the reduction in vehicle usage
- Number of kilometers of public transport routes in place
- Number of people using these transport routes
- Number of electric charging stations and vehicles
- Number of bicycle share schemes

- Sustainable Business Practices:
- Number of Green Leaf Certified Hotels, Cafes, Restaurants, and businesses
- Number of LEED Certified buildings
- Implementation of a Sustainability Certification/Index for CM Green Businesses – Link with Green Leaf certification

- Cultural Preservation and Tradition:
- Number of Registered Cultural/Historical Places
- Traditional Artisans and Practitioners
- Education and Businesses for Traditional Skills

- Social Inclusion and Integration:
- Demographic Composition
- Social and Cultural Integration Initiatives
- Registered Migrant Workers

- Community Wellbeing and Safety:
- Community Social Capital Index
- Poverty Rate
- Crime Rates
- Accidents

- Health and Safety:
- Number of premature deaths annually in Chiang Mai
- Number of cases of respiratory illness
- Mortality rate attributed to air pollution
- Number of infant mortalities/nutrition stunting
- Injuries/fatalities from road accidents
- Number of drownings
- Drinking water quality illness cases
- Food-borne illnesses
- Number of suicides
- Number of people suffering from depression
- Rates of addiction to alcohol and drugs
- Number of reported domestic violence cases

- Access to Basic Amenities and Services:
- Access to education on sustainability
- Access to education on life skills
- Percentage of households with access to basic services (electricity, sanitation)
- Living cost

- Community Life:
- Urban recreation opportunities (natural, cultural, sport, entertainment spaces)
- Social engagement and community events
- Personal safety and community trust
